Balance sheet analysis guide
You’re just minutes away from the very best that financial analysis experts have to offer. A unique approach.
- Balance sheet analysis skills are easy to acquire with the right information.
- Pure step by step knowledge designed to enhance strategic management skills.
- Increase revenue with informed decisions.
The “Profitability” section below is a sample from the Balance Sheet Analysis Guide.
Profitability
Profitability is a measurement of operational performance.
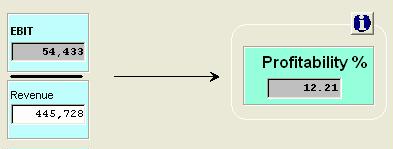
It is illustrated in the following diagram:
Profitability represents the operating performance of a business expressed as a return on sales after all costs have been covered except interest and tax.
The ratio for profitability is:
PROFITABILITY % = EBIT / REVENUE
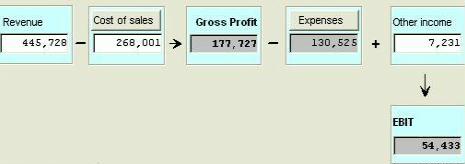
EBIT is Earnings before interest and tax. A summarized form of the income statement is below, to show how to calculate EBIT.
Note: You may be using another term for EBIT e.g. PBIT (Profit before Interest and Taxes).
From the profitability diagram above, it can be seen that this business has a profitability of 12.21%. For every $100.00 of revenue, the business makes a profit of $12.21.
For any business the trend in profitability is important. If it goes down, then from the profitability diagram above it can be deduced that one or more of the following may have occurred:
Revenue went down or expenses went up.
Profitability Drivers
The drivers of profitability are revenue (price and volume), cost of sales and expenses.
“Drivers” – these are the key items that, if changed, will affect Profitability.
Knowing the drivers, you can implement strategies to improve Profitability:
Revenue may be able to be improved by selling more (sales volume increase) or increasing prices (sales price increase). The marketability potential of the products or services of the business may need to be investigated to determine the potential revenue for the business. To improve profitability, the business should improve revenue and try to get cost of sales and expenses down. To maximize profits management should allocate resources in the most efficient way.
The Profitability measurement represents the operating performance of a business entity expressed as a return on sales. It provides a measure for comparing how efficiently a business can create operating profits from sales
It also provides a measurement of operational efficiency in the profit and loss account, void of finance costs.
Profitability will vary across industries – it may be useful to obtain typical values for your industry so you can compare your results with others.
Not all the drivers of profitability are equally easy to implement
Profitability Driver examples
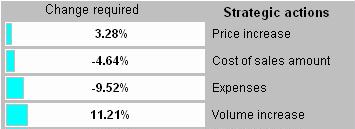
Here is a table of each of the drivers or “Strategic actions” for profitability. To increase profitability from 12.21% to say 15%, calculate how much each driver needs to be changed to achieve the desired profitability. These are shown below in order of the smallest change.
Notice that a price increase of only 3.28% is required to achieve the desired 15% profitability, whereas a sales volume increase (“more sales”) of 11.21% – almost 4 times as much – is required to achieve the same target. The target can also be achieved by reducing costs of sales by about 5% or reducing expenses by about 10%.
In practice, you may decide to implement a combination of the drivers to obtain the target. The drivers are useful in that they give you a starting point; they are a list of actions that should be considered to improve performance.
The blue bars on the diagram above are a visual indicator as to how easy it is to implement each action – the longer the bar, the more difficult it is to achieve. Every business will have a different set of numbers, and the order of ease to achieve will depend upon your own financials.
The above is the Profitability section of the “Balance Sheet Analysis Guide”. The full table of contents is shown below.
Balance Sheet Analysis Guide
Table of Contents
| Introduction | |
|
|
| Balance sheet format | |
|
|
| Balance sheet analysis | |
|
|
| Working capital analysis | |
|
|
| ROCE - Return On Capital Employed | |
|
|
| ROE – Return On Equity | |
|
|
| Debt to Equity mix | |
|
|
| Cash flows | |
|
|
| Sustainable growth | |
|
|
| Dividends | |
|
|
| Earnings per share | |
|
|
| Cost of Capital | |
|
|
| Conclusion | |
The Balance sheet analysis guide comes complete with the knowledge you need to …
| • Determine the financial strength and economic efficiency of a business. |
| • Understand how short term management decisions effect long term value creation. |
| • Understand the benefits of separating Funding and Operations on the Balance sheet. |
| • Learn the role of DuPont model in financial analysis techniques. |
| • Understand the role of ratios and cash flows in Balance sheet analysis. |
| • See where how and why particular ratios are used. |
| • See if the normal business operations are generating profits or incurring losses. |
| • Learn how to determine efficiencies with ratios. |
| • Discover how working capital management impacts on balance sheet performance. |
| • See the techniques to use to drive future strategic management decisions. |
| • View the relationship of Operational cash, Free cash flow and Net cash. |
| • Understand the effect of the Debt to Equity mix and leverage. |
… And much more for only $27.95
Click the Buy now link below to get your copy.
Balance sheet Analysis Guide
This is an e-book (pdf)
Claim Your Copy
$27.95


